ESP in the Press
Articles and Technical Papers
Analysis of NYMEX as a tool for Forecasting Prices of Crude Oil (WTRG Economics)
Crude Oil and Petroleum Product Price Outlook (WTRG Economics)
Cost of Supply Curve Graphic (Rystad Energy and Energy Security Partners)
Gas-To-Liquids Plants Offer Great Return On Investment (PDF File)
Oil Prices FAQ
Prepared by Jim Williams of WTRG Economics and Energy Security Partners
1. What lessons can be learned from past EIA projections?
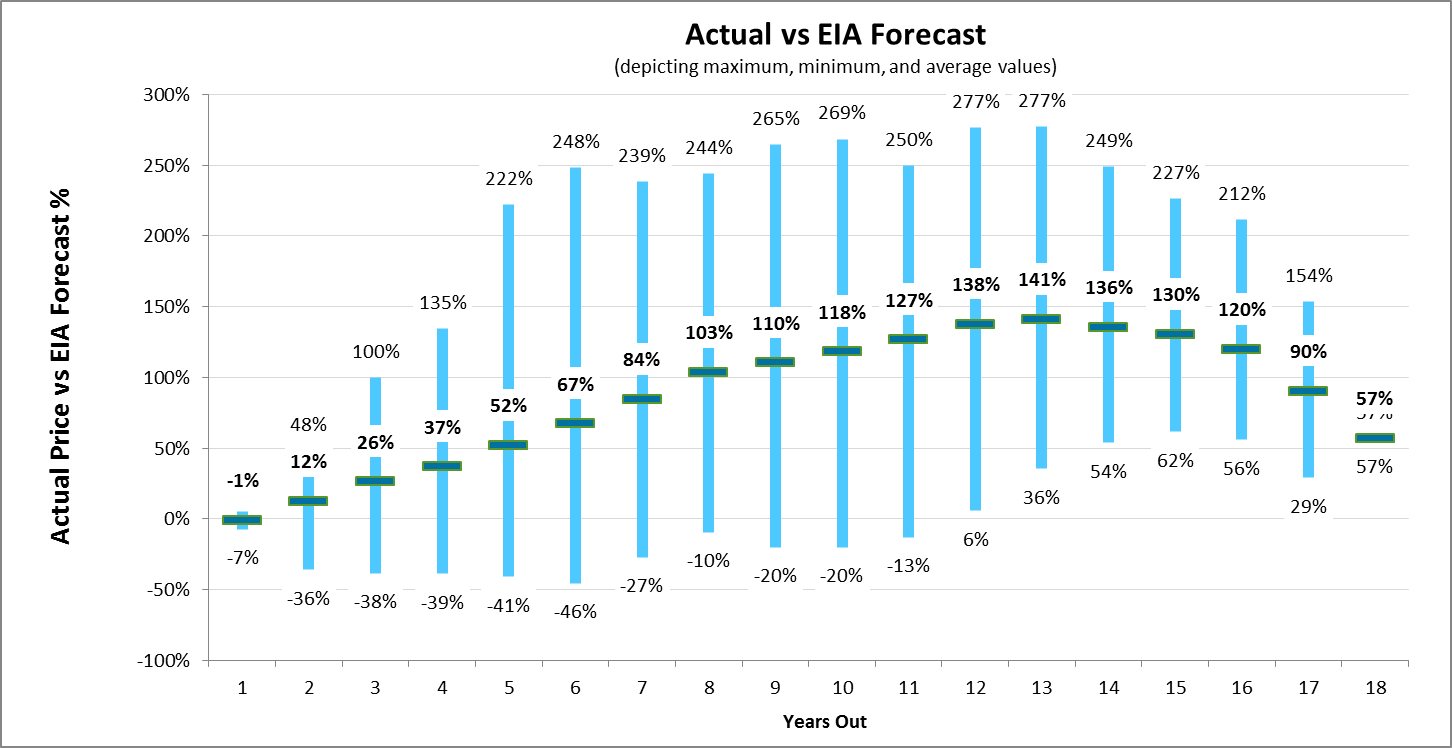
An examination of EIA long-term forecasts from 1994 through 2012 shows that on average, for forecasts over five years in the future, the actual crude oil price was at least 50% higher than the EIA forecast.
2. From past NYMEX futures prices?
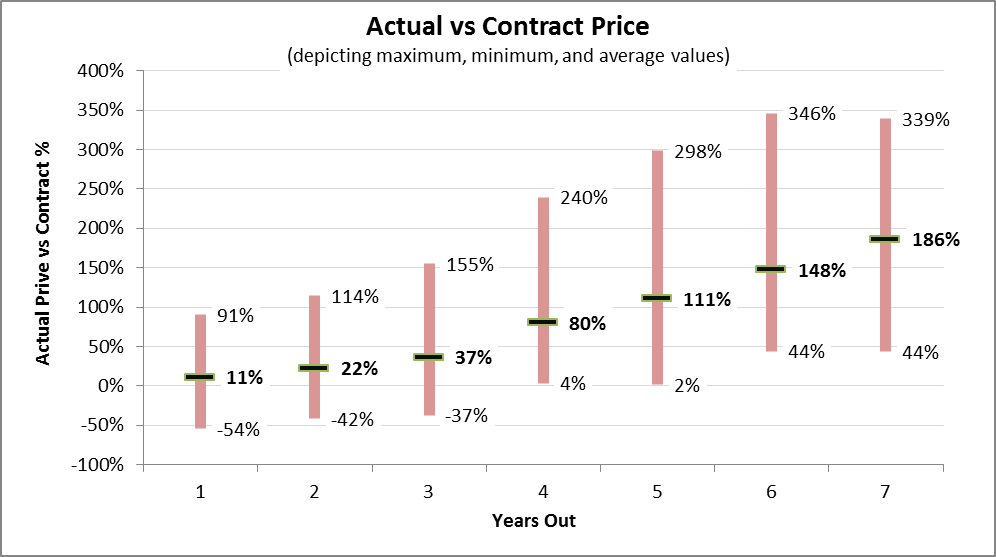
Our analysis of NYMEX futures contracts based on the average futures price for all available December contracts demonstrates that on average, the actual price was below the NYMEX price for 1 – 7 years out. Furthermore, in all instances for a time horizon greater than three years, the actual price was higher than the price implied by the NYMEX contracts.
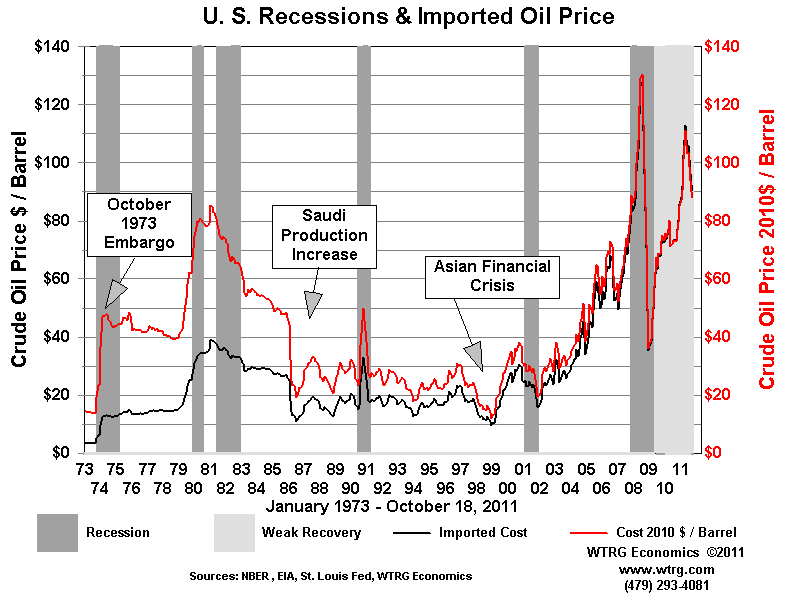
Supply interruptions in exporting countries and recession are the most identifiable events. The interruptions were caused by war, revolution and civil unrest. These vents led to price spikes which in turn were usually followed by recession.
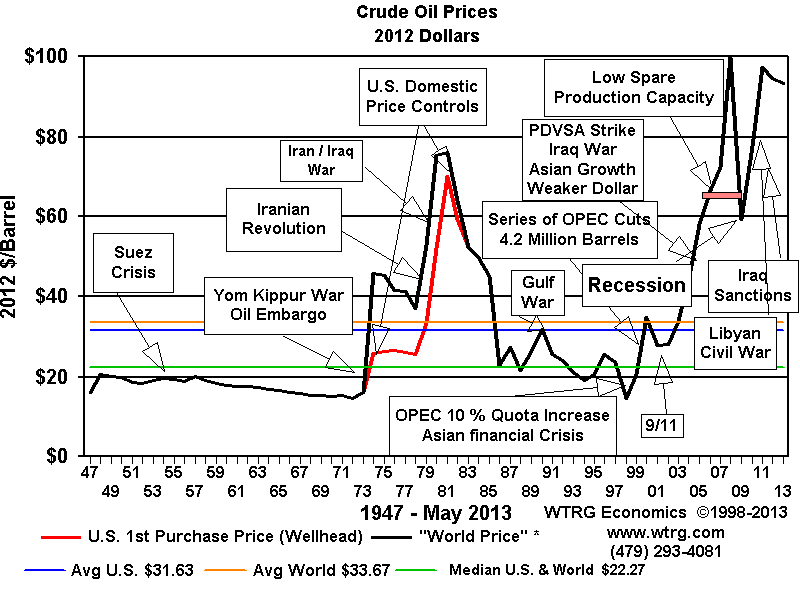
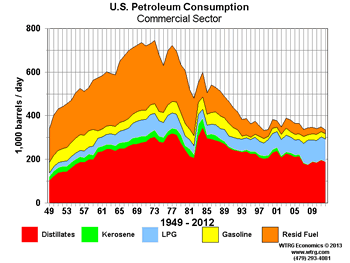
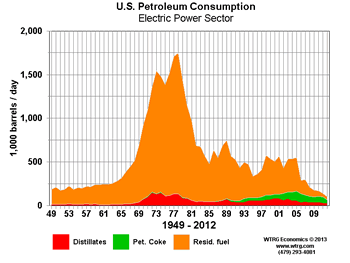
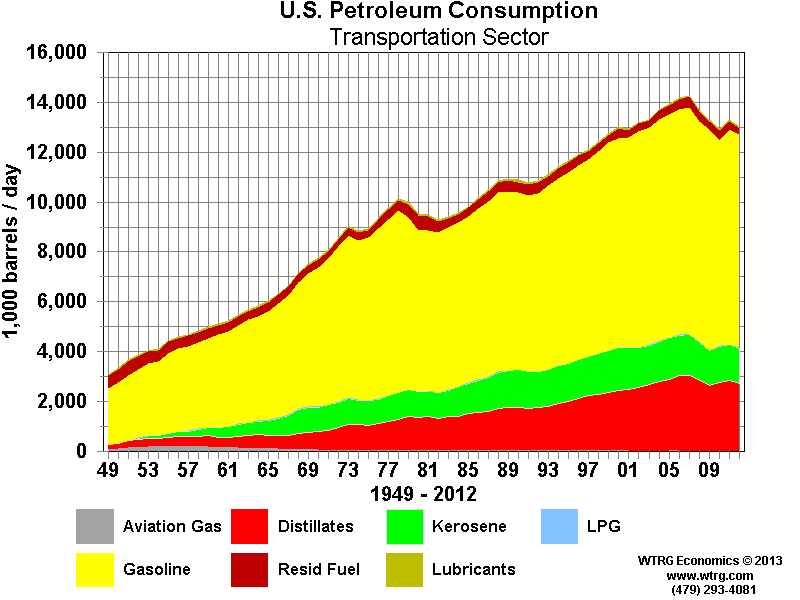
Recession and high prices lead to lower consumption of oil due to the drop in economic activity, increased efficiency and fuel switching in the developed nations. In most cases, the fuel switching was permanent. In the 1978 -1981 period, the power industry switched from fuel oil for generating electricity to natural gas, coal and nuclear power. Most homes and commercial buildings that heated with petroleum moved from oil to natural gas or in some cases electricity. Automobiles became more efficient but there was not fuels switching. Fuel switching is evident in all sectors except transportation where it is negligible in this specific context.
As the chart below illustrates, while higher oil prices usually lead to recession, recessions typically lead to lower oil prices. The Asian financial Crisis shows that the impact of recessions on oil prices is not limited to western economies.
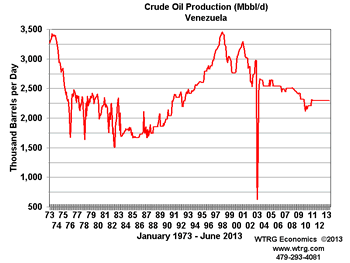
The causal factors for supply interruptions still exist. In the Middle East and North Africa (MENA), the contributing factors that lead to conflict remain and are generally along religious and ethnic lines: Christian vs. Muslim in Nigeria, Sunni vs. Shia and Kurds vs. Arabs in Iraq and Persians vs. Arabs in the Persian Gulf region. In Venezuela tensions are along the lines of social class. While not on the top of the radar screen, dissatisfaction in Muslim communities within the Former Soviet Union also poses a risk.

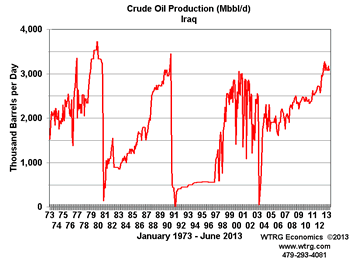


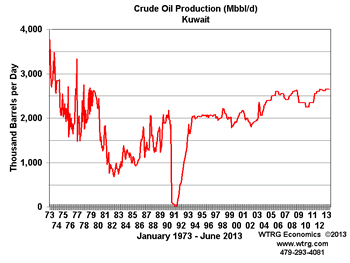
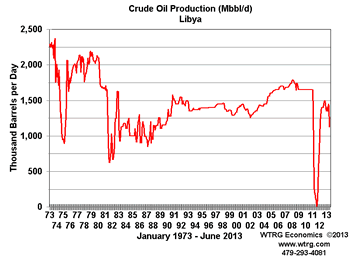
Persians and Arabs have been fighting for over three millennia; Sunni and Shia have battled for dominance since shortly after the death of Mohamed; Arabs and Jews since Moses; Muslims and Christians since the Crusades; and Kurds continue to fight Arabs and Persians in northern Iraq and Iran. Western sanctions against Iran continue and Venezuela is far from settled. In short, it is difficult to imagine a scenario in which they do not continue. Currently there is unrest Libya, Iraq and Nigeria as well as Egypt which is home to two major transit points: the Suez Canal and SUMED pipeline.
However, a solution to the nuclear issue with Iran could lead to a lifting of sanctions adding a million barrels per day to the market resulting in lower prices in the short term.
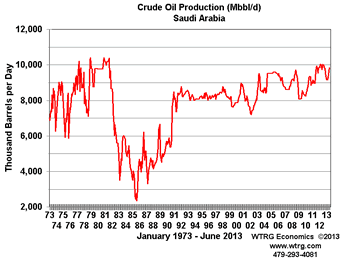
Libya could easily split into two or three countries. Two of Libya’s three regions have already declared themselves to be semi-autonomous. The Syrian civil war has spilled over into Iraq where almost 1,000 died in September, 2013. By any normal standards the internal conflict in Iraq would be considered a civil war, but it is only now beginning to be recognized as such. Saudi Arabia has managed to avoid the Arab Spring, but suffers from many of the problems of other countries in the Middle East and North Africa (MENA). Any scenario that spans a decade or more must consider the potential for revolution in Saudi Arabia.
Any extended period of low oil prices threatens MENA countries dependent on oil exports. Most MENA exporters’ budgets breakeven is above $85 per barrel. Without sufficient income to support social programs, the probability of internal unrest increases. Therefore, OPEC can be expected to take measures to defend prices at $85 per barrel.
Oil supply
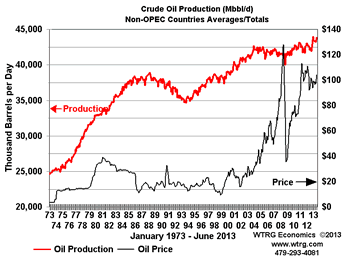
Non-OPEC
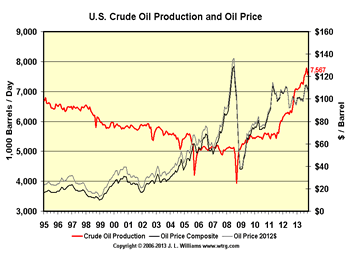
Most of the easy oil has been found and many mature fields are in decline. Enhanced oil recovery techniques from water to CO2 floods are now common. The major change onshore is the application of horizontal drilling with fracking which allows production from shale and other tight formations with low porosity. This technology led to a sharp reversal of the downward trend in U.S. production. Another is offshore production of pre-salt oil below thick offshore salt layers. Identification of these formations is a result of better imaging (seismic) technology.
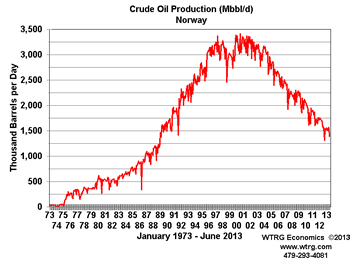
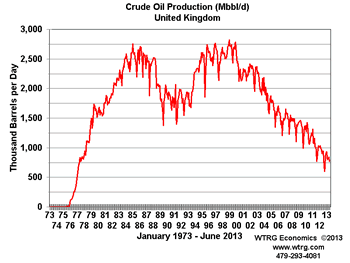
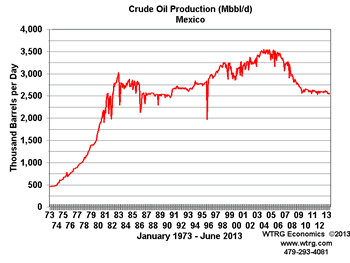
Many of the non-OPEC sources of higher production in the 1980s are in decline. Mexico is attempting to pass legislation to allow foreign investment in its petroleum industry in an attempt to reverse the drop in production which is down 28% from the 3.4 million b/d peak in 2005. North Sea production continues to fall with the United Kingdom down 73% from the peak and Norway off 59%.

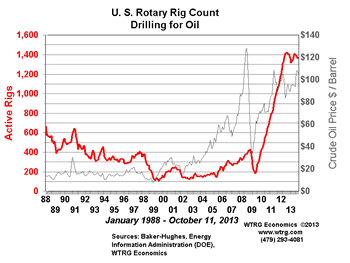
Less favorable terms and increased participation by national oil companies have also slowed the rate of production growth. The U.S. has oil reserves that are well explored and produced which generally yield far less oil per well than those in OPEC member countries, but the decision to allow exploration in the U.S. is between the individual that owns the mineral rights and the company that wants to drill and produce the oil. In contrast, in almost all other countries the state owns the mineral rights. The result is a slower response time and in many cases the state will receive well over half of the value of the produced oil where in the U.S. 20% is typical. This creates a stark contrast between drilling activity in the U.S. compared to the rest of the world. The U.S. has more rigs drilling for oil than all other countries reported internationally by Baker Hughes.
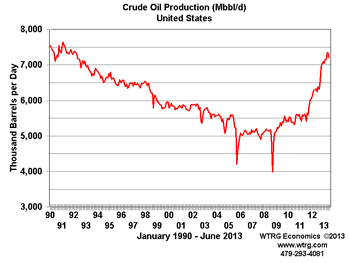
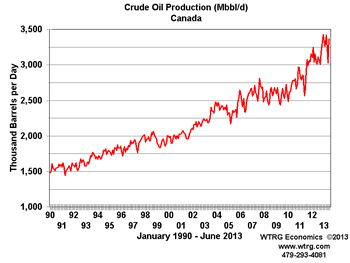
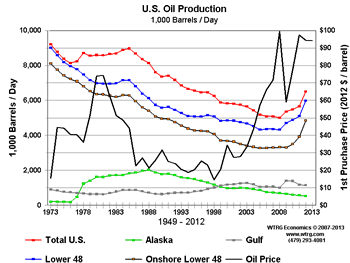
Recently, the most substantial gains in non-OPEC production came from the U.S. and Canada. In less than three years, production in the U.S. increased over 2 million barrels per day and us up 50% from 2008.
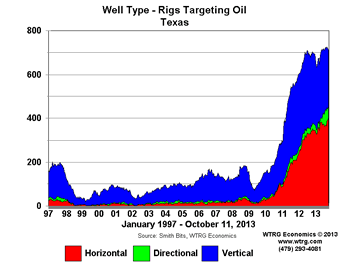
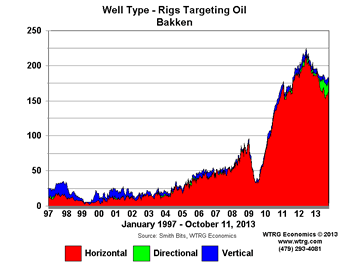
The increases are concentrated in Texas and North Dakota. Texas is up over a million b/d while North Dakota’s Bakken formation in now producing more than 900,000 b/d and should pass a million early in 2014.
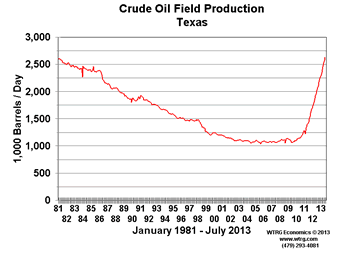
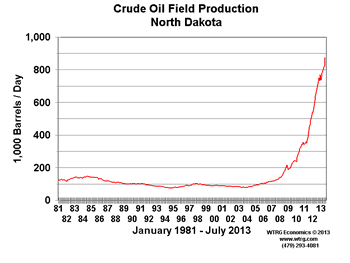
Combined North Dakota and Texas are home to 65% of all oil drilling activity. While almost all of the increase in North Dakota comes from horizontal wells that is not the case with Texas.
While it appears that the U.S. could continue on a higher production path for many years that scenario is subject to oil prices. The breakeven for many of these wells requires oil prices above $80 per barrel. Any dramatic drop in the price of crude could bring a corresponding collapse in drilling activity.
Oil demand
On the demand side, the imposition of high taxes on petroleum products increases the effective cost to consumers and inhibits demand. This is most evident in case of transportation fuels in Europe. Also, some countries which have traditionally subsidized fuel prices are considering steps to reduce or eliminate the subsidies. Price impact on consumption is detailed below.
What have been past demand destruction prices during the past 40 years?
There are two periods of major demand destruction associated with high oil price. They are best illustrated by the U.S. experience. The first came with the price spike in the late 1970s when U.S. consumption dropped by close to 20% over a 5-year period as oil prices climbed to peak in early 1981 at $82 per barrel in today’s dollars. The second began in 2008 when prices averaged over $100 per barrel in today’s dollars. Both eras were associated with strong recessions but the Great Recession of 2008 only led to a 10% drop in consumption.
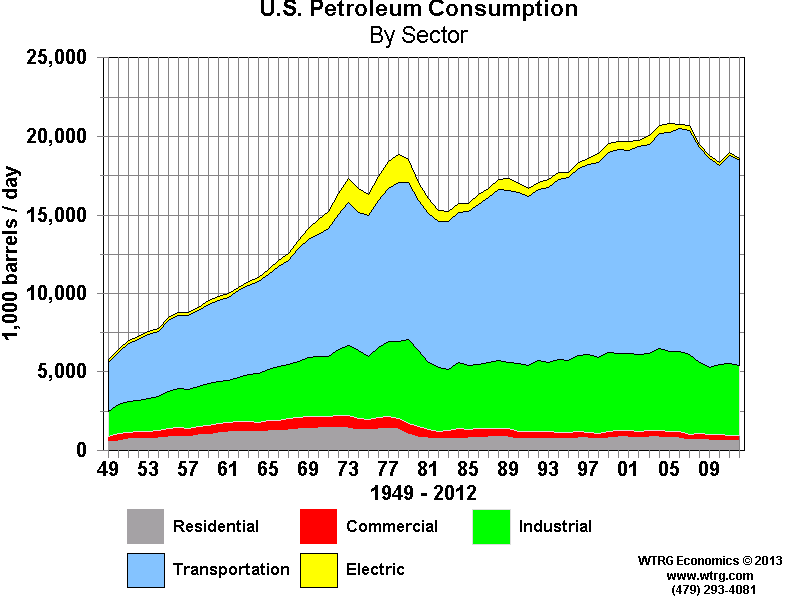
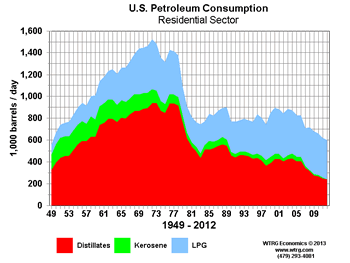
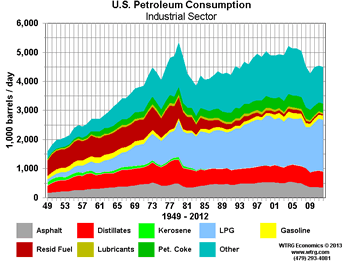
Despite 2008 being a stronger recession, the decline from 2007 – 2012 was half as great because the mix of products changed dramatically from the late 1970s. In the 1978-1983 period, the use of fuel oil for heating was greatly diminished as residential and commercial consumers substituted natural gas and increased the insulation in their buildings. The power sector switched to coal, nuclear power and natural gas in the first period. By 2008, most of the fuel switching from heating oil that could be done in the residential, commercial, industrial and electric power sectors, had been accomplished in previous years.
Compared to the 1977-1983 consumption peaks and troughs for the previous four sectors, transportation fuel use peaked a year later in 1978 at 10.2 million barrels and hit bottom a year earlier in 1982, down 853,000 b/d (8.4%). In 1986, just eight years after the previous peak, consumption of oil for transportation fuels was back at 10.2 million barrels per day. From 1986 to 2012, total petroleum use increased from 2.3 million barrels per day (14.0%) to 18.6 million b/d, but all of the gain was in the transportation sector. All of the increase in petroleum use from 1986 to 2012 was in the transportation sector (2.8 million b/d (27.1%) to 13.0 million b/d), with petroleum consumption in the other sectors declining 550,000 b/d (9.0%) over the same period.
Virtually all of the demand destruction in the U.S. was outside the transportation sector. However, there was some happening in the form of more efficient automobiles, trucks and airplanes.
In the United States and other developed countries the response to price spikes and the associated demand destruction is similar. Consumption in OECD countries resembled that of the U.S.
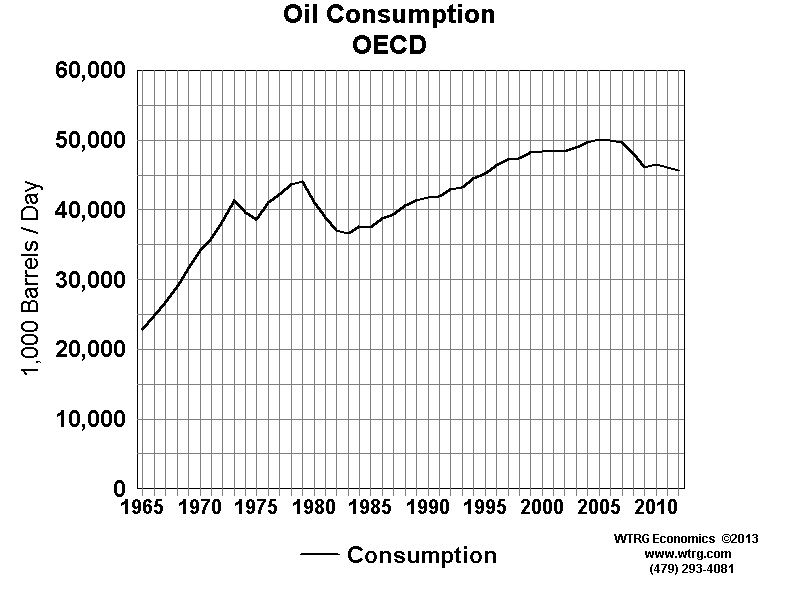
Contrast the OECD with the less developed non-OECD nations. There was a slower rate of growth due to the 1978-1981 price increase. However, since 1965 non-OECD petroleum consumption only declined from 1990 through 1993.
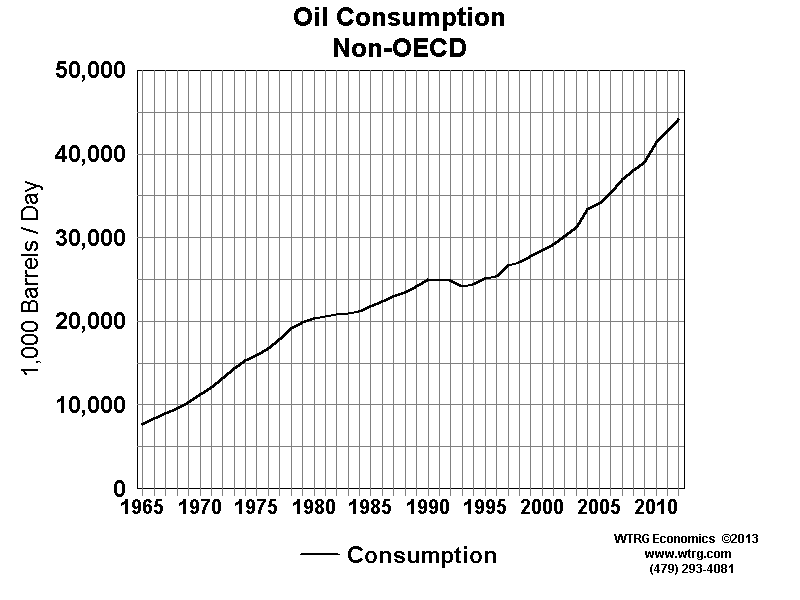
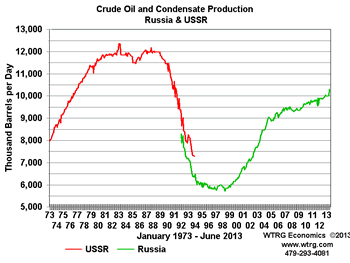
The 1990-1993 decline was only 750,000 b/d (3.0%) and does not correspond to a sustained period of high prices. Using aggregate non-OECD data masks one of the major events of the 1990s. The Former Soviet Union collapsed in 1991. From 1990 to 1993 FSU consumption fell 2.6 million b/d (45.5%). If we remove the FSU from the non-OECD data, rather than a modest decline, consumption increased 1.9 million b/d (11.6%). The economic collapse was so great that FSU consumption remains at near half the level before the breakup. In a sense, the FSU could provide an example of demand destruction due to low oil prices. Oil and natural gas exports were the major source of export revenue for the Soviet Union and the low oil prices in the mid to late 1980s certainly contributed to the collapse.
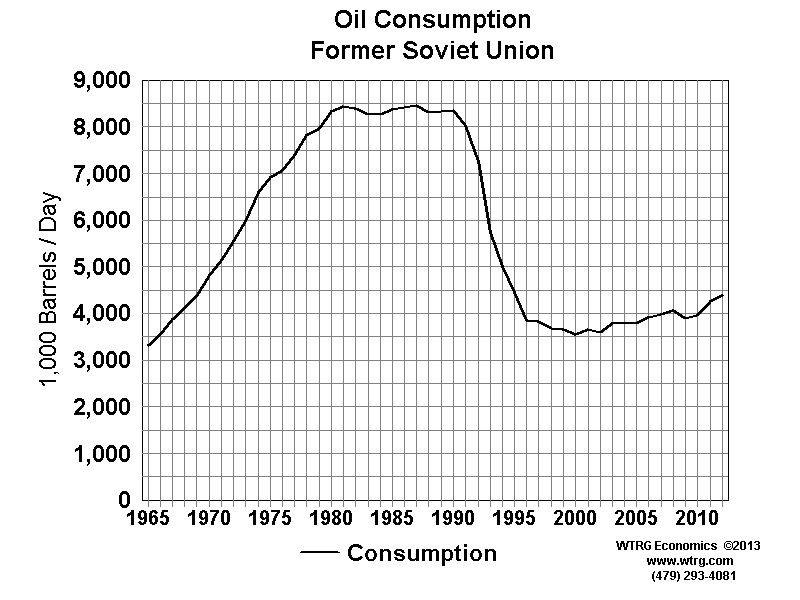
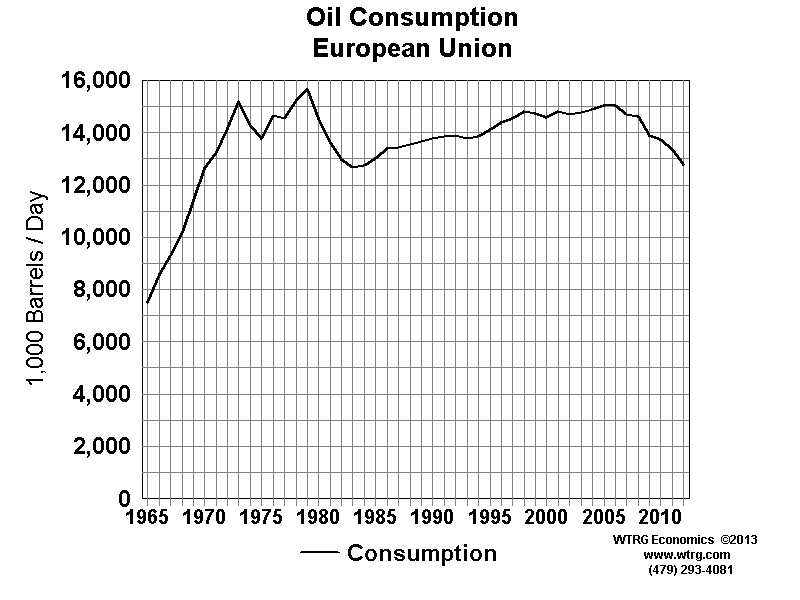
The next chart shows consumption by region. North America, Europe and Eurasia show a clear response to higher prices with some enduring demand destruction in the two periods we emphasized. Once again we see the impact of the breakup of the FSU in the Europe and Eurasian data.
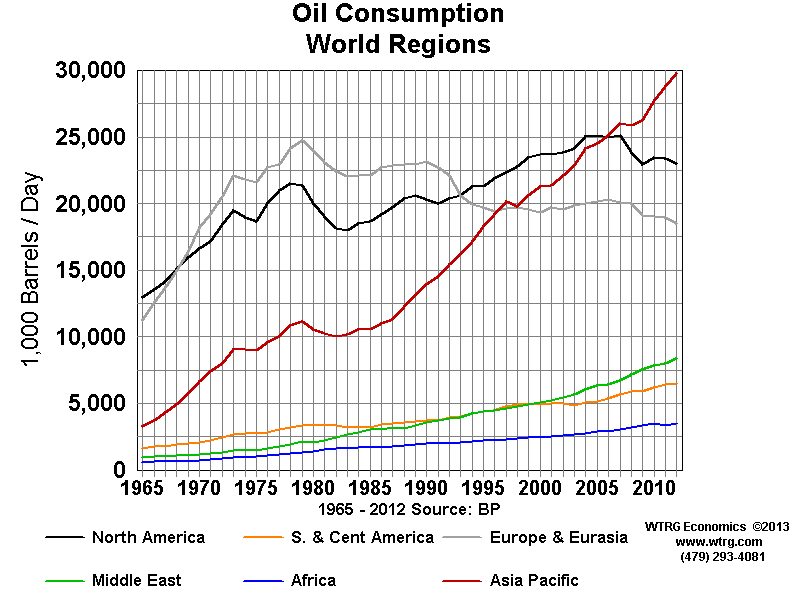
Removing Eurasia, the European data in isolation is similar to that of North America and clearly shows the impact of the two major price increases. It exhibited a lower growth rate in the post 1983 period due to the high taxes on transportation fuels.
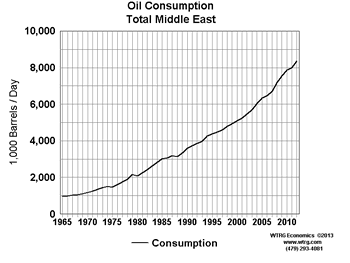
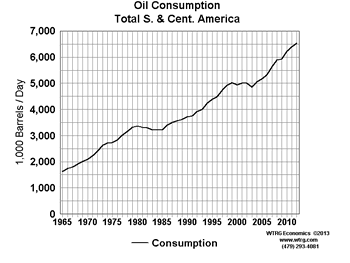
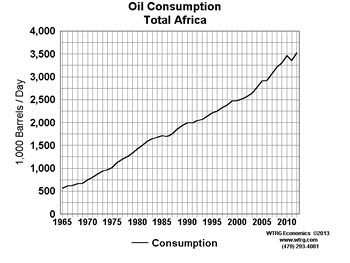
Except for the Asia Pacific region’s response to the 1978-1981 price run-up, the four remaining regions show muted demand response to major price increases. However, lower oil prices in the 1986-1988 period had a negative impact on consumption growth in the Middle East and Africa (MENA). At first glance this might seem counter intuitive, but it was the result of lower income and economic activity in Middle East and North Africa (MENA) where the major source of export revenue is oil and gas. All but two of the current OPEC members are in MENA.
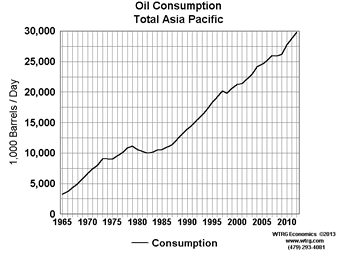
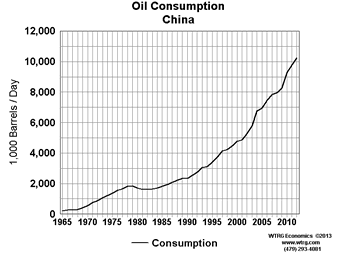
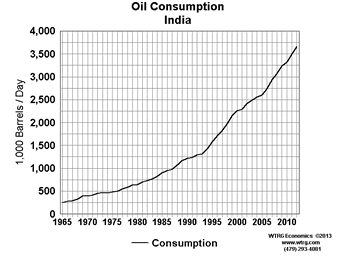
About five years ago the Asia Pacific region surpassed North America as the largest consumer of petroleum. Within that region, China, Japan, India and South Korea accounted for 71% of petroleum use in 2012.
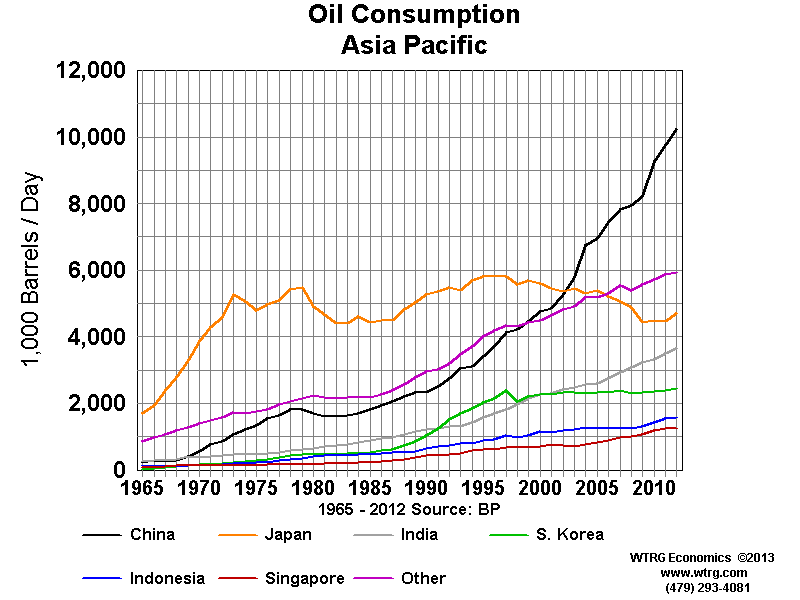
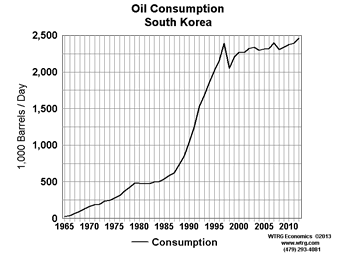
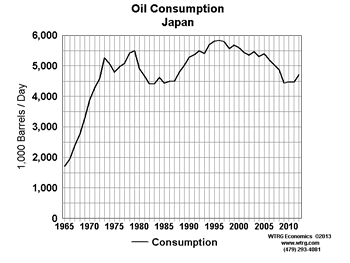
The more developed economies of Japan and South Korea respond to oil prices in a similar way to the U.S. and Europe. Japan, which is totally dependent on imports, is the most sensitive to price increases. South Korea will be more dependent in the future as its economy matures.
Two major sources of world consumption growth are China and India. Neither has exhibited high sensitivity to oil prices. In the 2008 price spike and recession, China’s growth in petroleum use slowed for a couple years, but recovered quickly. With large populations and fewer vehicles on average than other developed nations, usage in both countries should continue to experience strong growth for the foreseeable future. Excluding motor cycles and bikes, India and China have 18 and 85 vehicles per 1000 people respectively compared to South Korea’s 376 and Japan’s 591. This indicates a growing potential market for petroleum use as a transportation fuel in both countries.
In summary, only developed countries show substantial demand destruction in the face of high prices. The only enduring demand destruction is in the Former Soviet Union and is unrelated to high prices. The high energy density of petroleum on a mass and volumetric basis gives it a unique advantage as a transportation fuel. Because of that factor, as the percentage of use in the transportation sector increases, the sensitivity to price spikes declines since it is less subject to fuel switching.
What have been past supply destruction prices during the past 30 years?
Supply destruction is similar to demand destruction in that it driven by price drive, but the lags between price changes and production changes are longer outside of OPEC and shorter within OPEC. As with the demand discussion we will start with the United States.
United States Supply Destruction
Except for the period when the Texas Railroad Commission and its counterparts in the major producing states would curtail production to support prices, we find that production in the intermediate term is driven by the level of investment in drilling new wells. One of the best indicators of investment in new wells is rotary rig count. Rig count is the number of rigs drilling for oil or natural gas at any given point in time. All things equal, the higher the rig count the greater the number of new wells completed and the greater the production from those new wells.
Typically there is about a 3 month lag between price changes and drilling activity. That lag is longer for offshore drilling than onshore. It is worth noting that the record land rig count in the late 1970s and early 1980s was resulting in a relatively small increase in onshore oil production. That increase was temporary and associated with a price near $80 per barrel in today’s dollars.
Offshore drilling activity responds to the same price signals. Because it requires a greater capital investment and longer construction times for platforms and underwater pipelines, the time between price changes,rig activity and production are all longer than onshore drilling.
Similarly, the initial development of Alaska’s North Slope had a long lag because of the time necessary for pipeline construction. It took about $30 per barrel in today’s dollars to spur the growth in Alaska. As that play matured, even the recent $100 per barrel price had little impact on production.
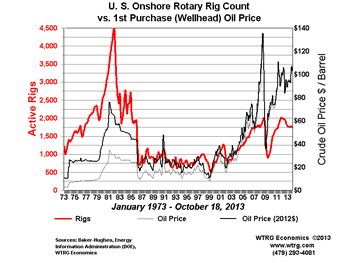
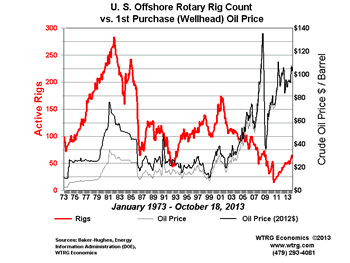
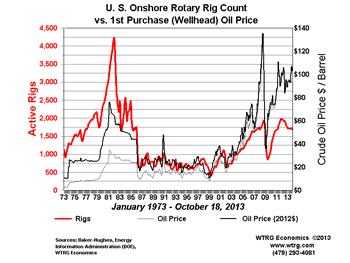
More recently, the price spike in 2008 lead to an increase in investment and drilling activity, but oil investment measured by rig count reached 400 rigs several months after the peak in prices. By that time the price was falling with the impact of the recession on consumption. From the low near $30 per barrel in late 2008 prices rose steadily to plateau near $100 per barrel. With this price came resurgence in drilling activity with the number of rigs in the 1300 – 1400 range, which is the highest level in over 30 years. The increases had a marked impact on production and indicate that supply destruction occurs at prices somewhere below $60 and supply increases in the U.S. require prices above $80.
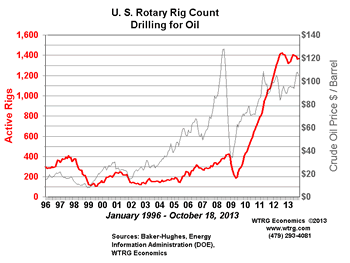
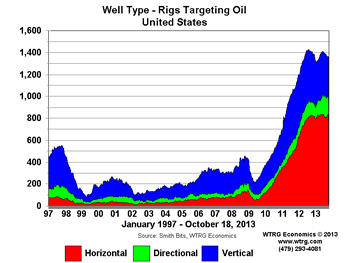
The production gains of the last few years are a combination of two factors: historically high sustained prices and the development and application of horizontal drilling and improved fracking to oil production. The application of this technology is more expensive than traditional vertical wells and in most cases requires oil prices above $80 per barrel to generate acceptable returns.
American production growth requires high oil prices and in the face of lower prices could easily return to a steady decline. To illustrate the point, at present the EIA estimates that every rig running in the Bakken formation in North Dakota and adjacent states will result in an additional 482 daily barrels of production. Current production declines 60,157 barrels per day per month. This means that 125 of the 178 rigs running in September are required to compensate for the decline in existing wells. With no improvement in efficiency, a 53 rig drop in Bakken drilling activity would halt production growth in the region. This implies that if rig count falls below 125, production will be in decline. In reality, the number would probably be a little lower than 125 as the least efficient drillers would fall out first.
Forecasts of U.S. production continuing on the current growth path are dependent on prices remaining high.
International Supply Destruction
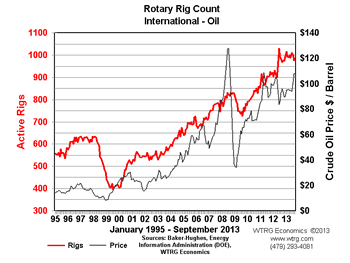
Supply destruction internationally is not as clear from the macro data. There is an inherent difference between oil exploration outside of the U.S. and Canada and virtually every other oil producing country. Outside the U.S. and Canada, virtually all of the mineral rights are owned by the state. That means virtually every drilling project must have government approval and governments often have different goals than individual mineral owners. Even if the goals coincide with typical profit maximization goals, government bureaucracies take longer to come to a decision. Furthermore, the behavior of OPEC member countries differs from those outside the organization. While the response is delayed, higher prices generally lead to more production in non-OPEC countries and lower prices to lower production. The same is true with OPEC but the responses to lower prices are faster within OPEC than outside the organization.
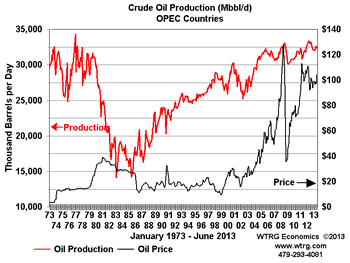
The price run-up in the late 1970s was caused by the drop in production from Iran and Iran during the war. The initial drop in OPEC production was due to the fall in Iraqi and Iranian production.

By 1981 the world recession caused a drop in consumption as non-OPEC supplies were increasing. In an attempt to maintain prices, other OPEC members began to cut production. By 1985, discipline was eroding and the Saudis shouldered a disproportionate share of the burden. It is a matter of debate whether the Saudis were tired of the lack of cooperation or whether a deal was cut with the U.S. to put pressure on the Soviet Union. In any case, the Saudis ramped up production in late 1985 and by 1986 the price fell to $10 per barrel. They doubled production and the price was cut in half. The move was revenue neutral for Saudi Arabia.
The low price eventually slowed growth in non-OPEC production which later took a nose dive with the collapse of the Soviet Union.

There are effectively three sources of supply destruction: War or revolution, low price or conscious decisions by OPEC to support price.
What structural changes have occurred in the oil and gas industry that indicate that future correcting mechanisms will be different than past?
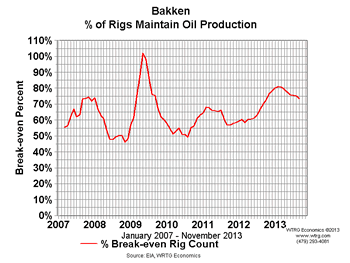
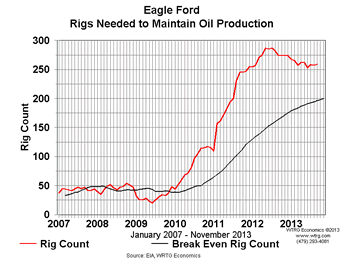
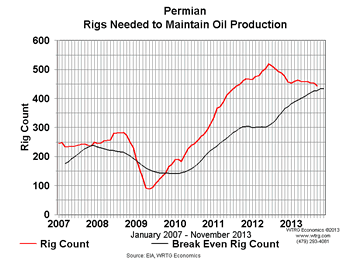
The single major change is better technology as exemplified by horizontal drilling and fracking in shale and other tight formations. However, it is costly and subject to very steep production decline curves in the initial years. It also faces strong opposition from environmentalists in the U.S. and other countries. At present, the technique requires large volumes of water which is a limiting factor in some areas. Because of the steep declines, a significant number of rigs are required just to maintain production. Recent data indicates that about 75% of the current rig count is necessary just to maintain production in the Bakken and Eagle Ford formations. The number is even higher in the Permian Basin which is the most active area in the United States with 450 rigs targeting oil. We estimate prices above $80 per barrel are necessary to maintain current production levels. Growth may start to slow below $90.
What socio-geo-political changes have occurred in oil producing countries that indicate that future correcting mechanisms will be different than past?
The so-called Arab Spring is the most notable change as well as the extreme socialist governments of Chavez and Maduro in Venezuela. The Arab Spring is largely due to the high unemployment rates among youth in the Middle East and North Africa (MENA). Oil exports have been able to fund large social programs that enabled governments to maintain power. However, the high rate of population growth in the MENA region outstripped the growth in oil production.
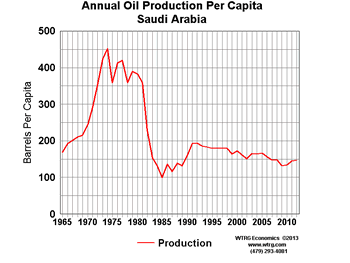
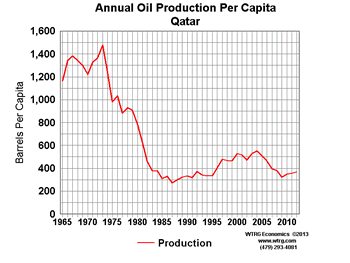
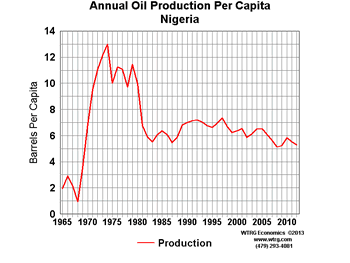
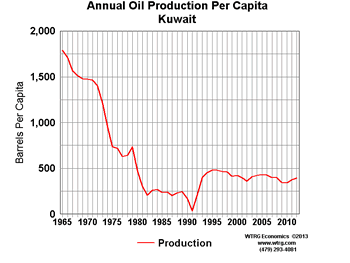
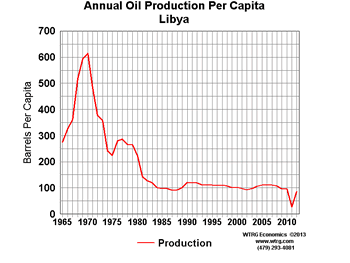
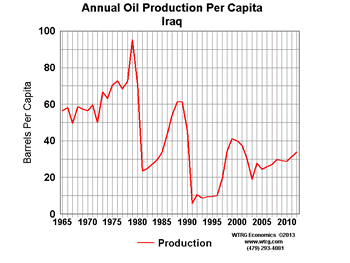
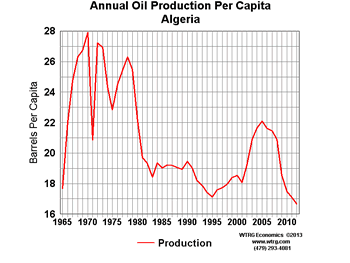
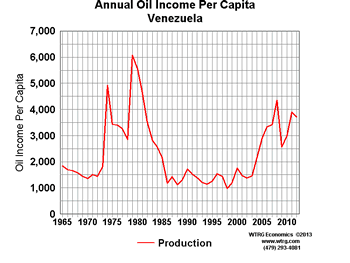
With the per capita production flat or declining for most OPEC members, the only way to maintain the export income at a level high enough to support government spending commitments is by higher prices. The following shows income from oil revenue on a per capita basis in 2011$.
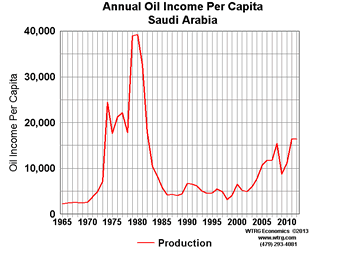
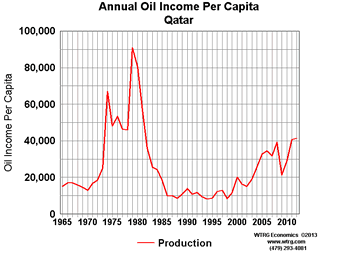
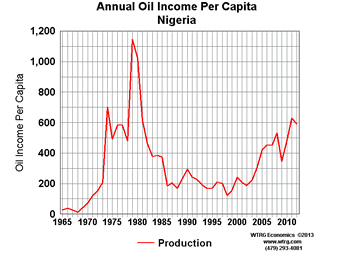
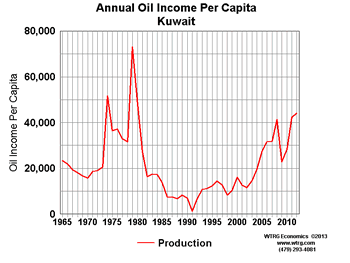
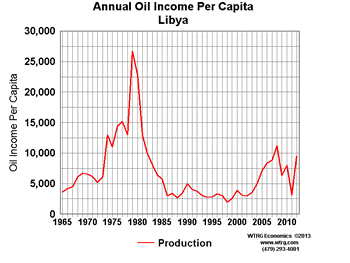
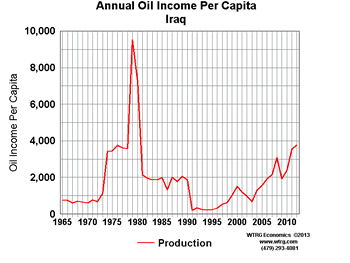
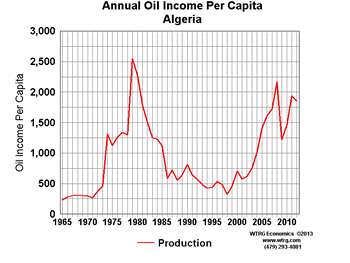
The per capita revenue actually underestimates the situation as it looks at total oil consumption and does not adjust for the growth in internal consumption of oil in OPEC member countries. A recent study by Arab Petroleum Investments Corporation (APICORP) shows the breakeven oil price for OPEC member budgets is at least $95 per barrel for all members except Kuwait and Qatar. This indicates that OPEC will almost certainly defend prices at anything below $90 per barrel.
More Industry News
(Source: Reuters)